Building on the Healthy Life Expectancy (HLE) article shared last week, this article overlays the updated Indices of Multiple Deprivation (IMD25).
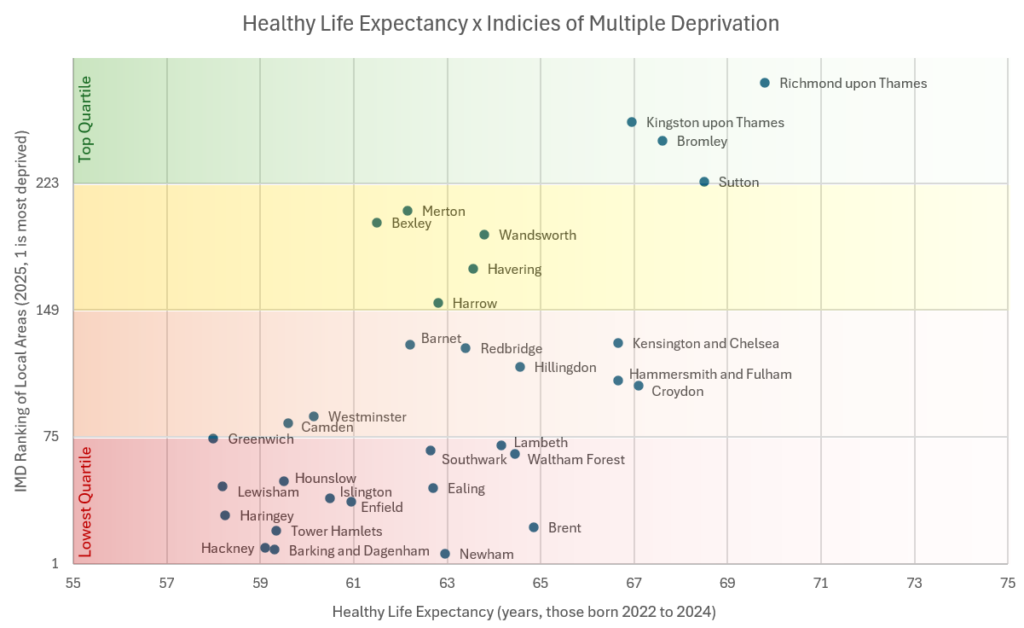
IMD is a measure of relative levels of deprivation. The above visual shows where the London Boroughs place relative to all of the Local Authorities across England for deprivation, ranked from the most deprived (1) to the least, and correlates this against HLE (years of expected healthy life).
There is a clear relationship between the two measures. Indeed, Health is one of the seven categories that inform IMD. The other inputs are Income, Employment, Education, Crime, Barriers to Housing and Services, Living Environment.
IMD sources show us that deprivation is not all clustered in one place. It is spread across England – 65% of all Local Authority Districts contain at least one of the most deprived neighbourhoods in England.
At the Local Authority (borough) level, London have 14 boroughs among the lowest quartile of IMD, and also 4 boroughs in the top quartile.
Alongside IMD are measures such as the Income Deprivation Affecting Children Index (IDACI) and Income Deprivation Affecting Older People Index (IDAOPI).
Across England, Tower Hamlets and Hackney rank as the most deprived LA’s regarding income deprivation among children. Alongside Newham, Islington and Southwark, these five London boroughs rank as the most deprived regarding income deprivation among older people.
These updates show that deprivation is uneven – across England, across London, and even within boroughs.
There are great tools available to understand IMD25