
The graphs above give us a picture of how London is spending on sport, physical activity, open spaces, and health programmes. They also show how much London households are spending on sport each week — and how the rising cost of living affects families with different income levels.
Here is what the data tells us:
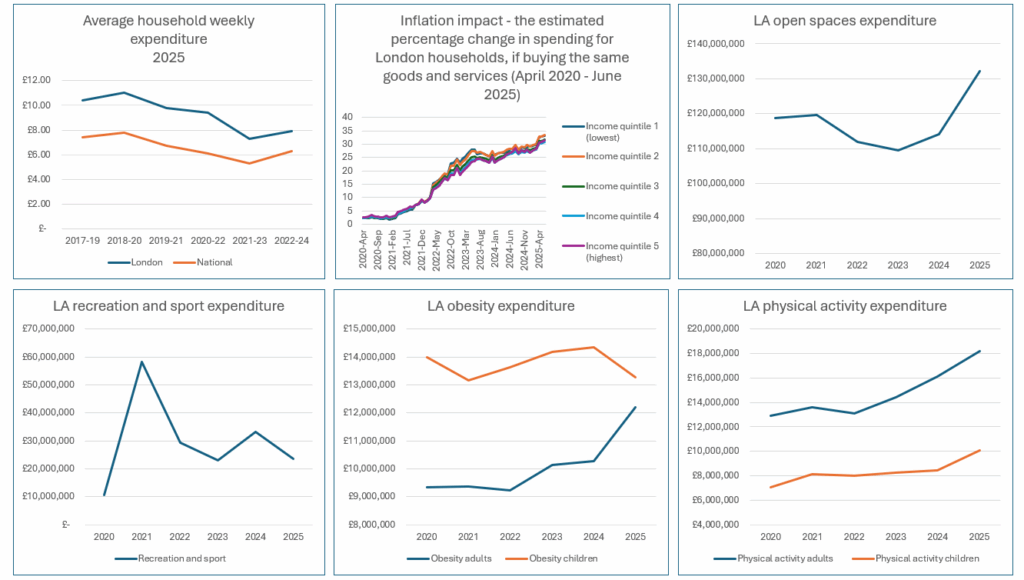
- London households are spending less on sport. Average weekly spending per household on sport has been falling over time (ONS, 2025).
- Rising prices hit lower income households hardest. Since spring 2022, the cost of everyday goods and services has increased faster for families on lower incomes (Trust for London, 2025).
- Local authorities are spending more on open spaces. Councils across London are putting more money into parks and outdoor areas than in previous years (Gov.uk, 2025).
- Spending on recreation and sport is going down. Despite higher open space spending, funding for recreation and sport activities has been falling (Gov.uk, 2025).
- More funding is going into adult obesity programmes, but less for children. (Gov.uk, 2025).
- Physical activity programmes for both adults and children are on the rise. (Gov.uk, 2025).
What does this mean for London?
The picture is mixed. Households are tightening their belts and spending less on sport, while local authorities are investing more in open spaces and health programmes. It looks like councils are focusing on helping people to move more — not just through organised sport, but through everyday physical activity that can be done for free or at low cost. This may reflect a wider shift: from structured sport towards affordable, accessible movement for health and wellbeing.
However, this shift could have knock-on effects for the sport and physical activity sector. If households continue to spend less on memberships and paid activities, clubs and organisations may find it harder to generate income. Over time, this could make it more challenging for parts of the sport sector to stay financially sustainable.
What does this mean for London Sport?
These graphs offer a bird’s-eye view of where we are now. They show how local priorities are changing, where funding is flowing, and how the cost of living is shaping participation in sport and activity across the city. By keeping track of these trends, London Sport can better understand where support is most needed — and how to make it easier for all Londoners to get active, regardless of income or background.