The latest Active Lives Adult survey data was released on Thursday 23rd April and covers the period between November 2024 and November 2025.
The data show that, in London:
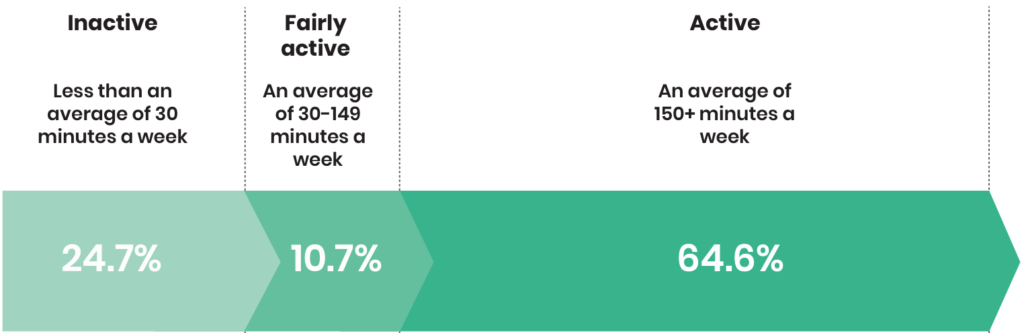
- Two-thirds of adults (66%, 4.8m) are classed as ‘active’, completing 150+ minutes of activity a week and achieving the Chief Medical Officer’s guidelines for physical activity.
- Just over 2.5m adults (34%) are not meeting the CMO guideline.
- There has been no significant changes in activity levels in London in the last 12 months.
- Hillingdon (33%), Barking and Dagenham (32%), City of London (31%), Brent (30%), Newham (30%), Sutton (29%), Bexley (29%), Croydon (28%), Harrow (28%), Enfield (28%), Redbridge (27%), and Hounslow (27%) have a higher proportion of ‘inactive’ adults than the London and national averages.
Nationally, significant inequalities remain:
-
- Men (67%) are more likely to be active than Women (62%) and those who describe themselves in another way (55%).
- Those from the lower socio-economic backgrounds are less likely to be active (54% of the least affluent adults are active compared to 73% of the most affluent).
- Activity levels generally decrease with age, with the sharpest decrease coming at age 75+ (44% of adults aged 75+ are active compared to 71% of 16-34 year olds).
- However, older adults are driving increases in activity levels with 2.1m (7.3%) more active 55-74-year-olds and 0.7m (10.9%) more active adults aged 75+ compared to nine years ago (Nov 15-16).
- Activity is less common for adults with a disability or long-term health condition (49%) than for those without (70%).
- Asian (excluding Chinese) adults (56%), those from other ethnic groups (56%), and Black adults (57%) are less likely to be active than White (69%) or Mixed (69%) adults.
- Gay men (68%), lesbian women (72%) and bisexual adults (74%) are all more likely to be active than heterosexual adults (64%).