
A new article in the International Journal for Sustainable Transportation compares the growth of cycling in London, Paris, Berlin and New York. It focusses both on participation and the impacts of policy and infrastructure changes.
Headlines:
- Cycling increased in all four cities from 1990 to 2019. London went from 1.2% to 3.7% of journeys in that time.
- Cycling has continued to increase since Covid. London at 4.5% in 2023.
- The likelihood of injury per trip has reduced since 2005.
- Improvements are attributed to…
- More and better infrastructure (protected bike lanes, improved junctions).
- Bike parking and bike sharing systems.
- Car restrictions, traffic calming, implementation of ‘School Streets’.
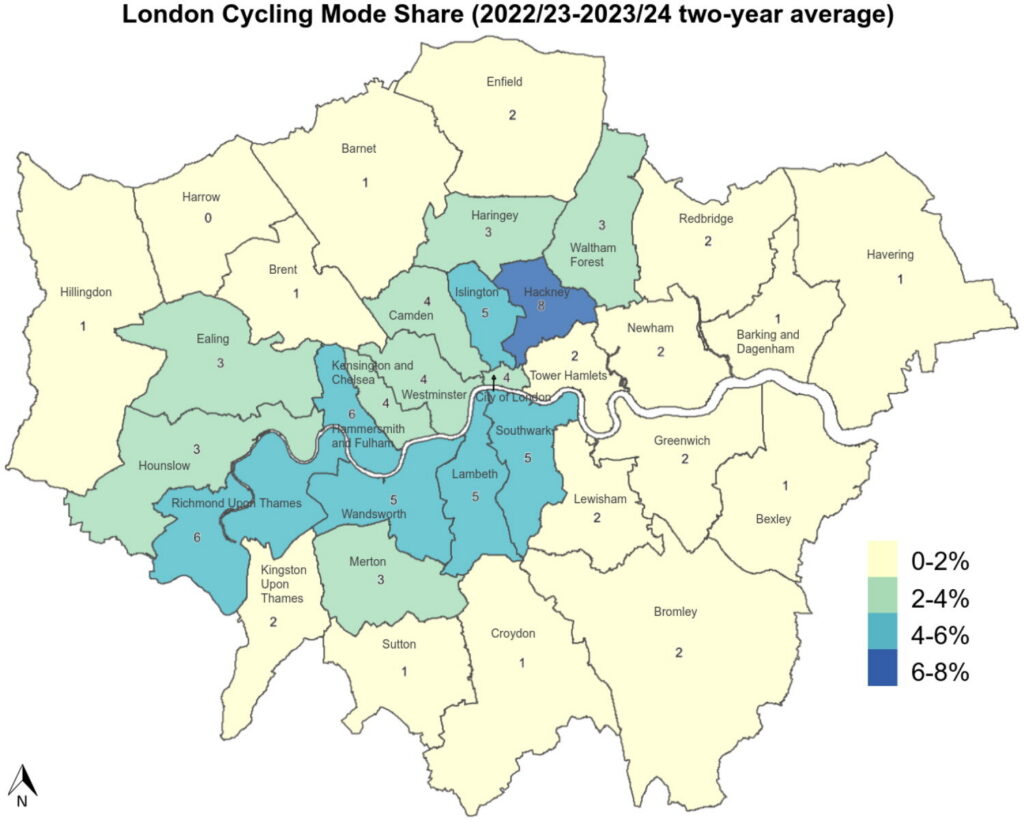
- Inner London boroughs and Outer South-West boroughs tend to have the highest bicycle mode shares, ranging from 4% to 8%. One exception is Tower Hamlets (2%).
- Cycling levels in the rest of England remained flat from 2014 to 2024, as “pro-cycling policies have lagged far behind London“.
The article also references:
- London’s Direct Vision Standard for heavy trucks, which improves visibility of cyclists and pedestrians.
- Growth of the London Cycle Network from 435km to 2179km (mostly between 2001 and 2010). The LCN is mostly painted bike lanes in quieter routes, but not separate infrastructure.
- The 2018 Mayor’s Transport Strategy (Strategic Cycle Network), which was a “move away from the perceived poor quality, patchwork LCN to a more strategic approach to delivering better infrastructure – in particular, more protected bike lanes – where it could have the most impact.”
- Since then Londoners living within 400m of the SCN has increased from 12% in 2019 to 27% in 2024, and TfL aims for 40% by 2030.